


Analysis of the model for a 4.40 m flood at the
Mopti scale
With
a
maximum
water
height
of
4.40
m
at
the
Mopti
scale,
the
1984
flood
was
the
lowest
recorded
since
1922
,
the
onset
of
records.
This
poor
flood
resulted
from
very
poor
rainfall
in
the
upstream
basin
of
the
Niger
and
Bani
rivers,
in
humid
and
sub-
humid bioclimates. Meanwhile in the Sahel it was the most severe drought recorded since the beginning of the 20
th
century.
,
In
Ké
Macina,
when
the
Niger
River
enters
the
Delta,
the
flood
was
higher
by
0.54
m
than
expected
from
the
propagation
model
proposed
by
J.P.
Lamagat
for
a
flood
height
of
4.40
m
at
the
Mopti
gauge,
and
this
height
was
reached
twice
(3.96
m
and
3.97
m)
six
weeks
apart.
If
the
flood
of
the
Bani
River
observed
at
Sofara
corresponds
to
the
flood
calculated
by
the
model,
the
flood
at
the
exit
of
the
Débo
at
Akka
shows
a
very
strong
deficit
with
a
very
short
duration
for
the
propagation
along
the
Mopti
to
Akka
reach
(11
days
versus
39
days).
There
is
therefore
a
strong
imbalance
between
the
flood
on
the
western
branch
of
the
Delta
along
the
Diaka,
which was well supplied, and the Eastern branch, the Bani and Niger towards Mopti, poorly supplied.
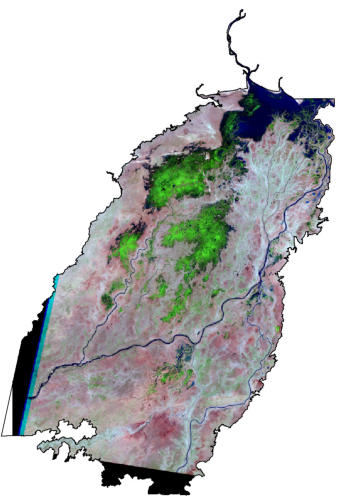
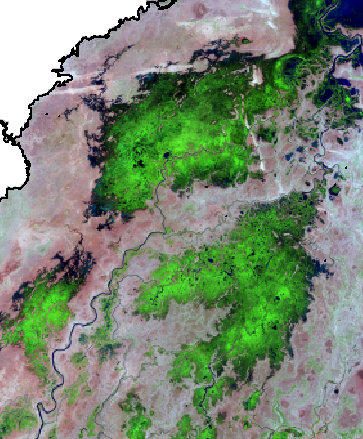
A
series
of
Landsat
images
(25
Oct,
10
Nov,
26
Nov)
was
available
to
analyze
this
exceptional
year.
The
image
of
November
10
gives the best information on the extent of open water and the green vegetation across the Delta.
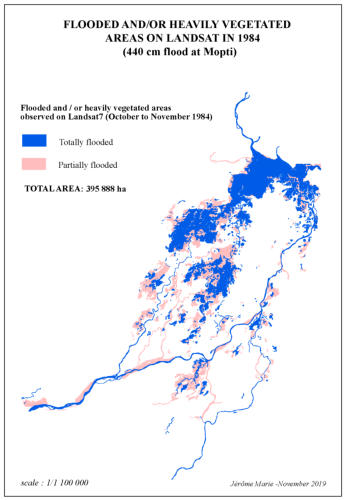
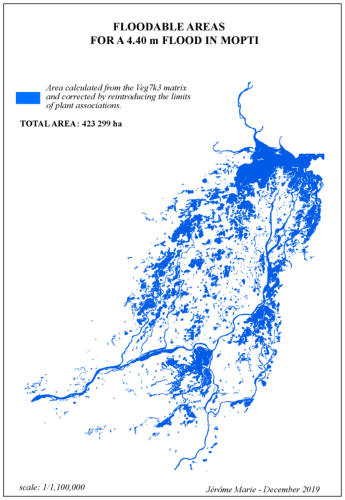
The
flooded
areas
calculated
by
the
model
(map
Niv_440)
extended
on
fragmented
basins
with
a
total
area
of
open
water
and
green
vegetation
of
423,299
ha.
The
transposition
of
the
model
in
Veg7
-
shape
(Niv_440_Veg7)
-,
after
correction
of
the
residuals
linked
to
the
smoothing
of
the
Veg7k3
matrix,
gives
a
floodable
area
of
391,484
ha,
the
figure
retained
for
comparison
with
the
Landsat images.
The
flooded
area
appears
fragmented,
with
a
block
around
the
Débo-Walado,
poorly
flooded
central
basins,
and
very
little
flood
in southern basins such as Yongari-Mangari, Sebera, Bani and Pondori.
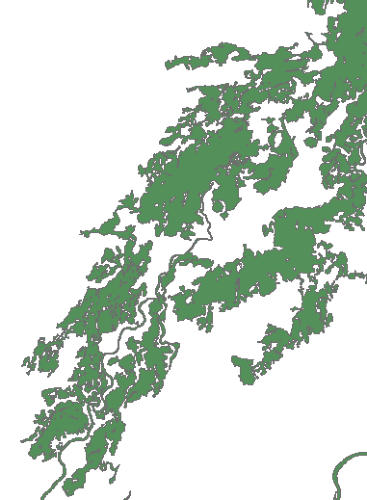
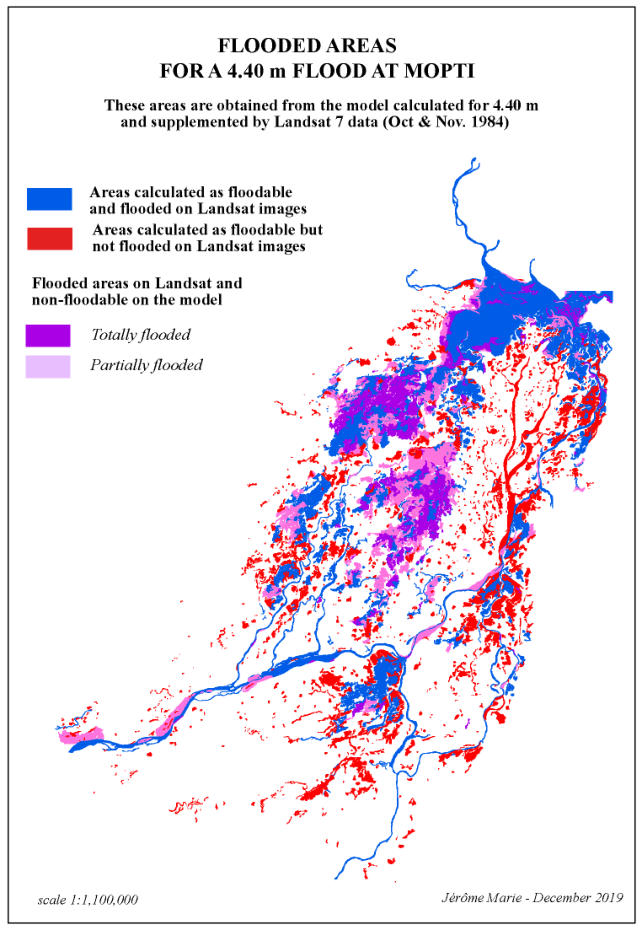
The
analysis
of
the
Landsat
images
makes
it
possible
to
separate
open
water,
the
dense
green
vegetation
of
the
flooded
plains
and
the
light
green
vegetation
of
the
non-flooded
plains
and
“
togge
”
as
well
as
bare
soils.
Overlaid
on
Veg7
(shape
Veg7_1984),
the
flooded areas with or without dense vegetation where further separated as fully or partly flooded areas.
The areas were calculated in two different ways:
1
.
by counting pixels on Landsat
2
.
by reporting Landsat data on shape Veg 7, resulting in Veg7_1984
If
we
consider
that
the
partly
flooded
areas
are
effectively
flooded
at
50%,
the
flooded
area
assessed
from
the
vegetation
map
in
1984 would be 321,225 ha, close to the 325,453 ha measured by pixel count on Landsat images.
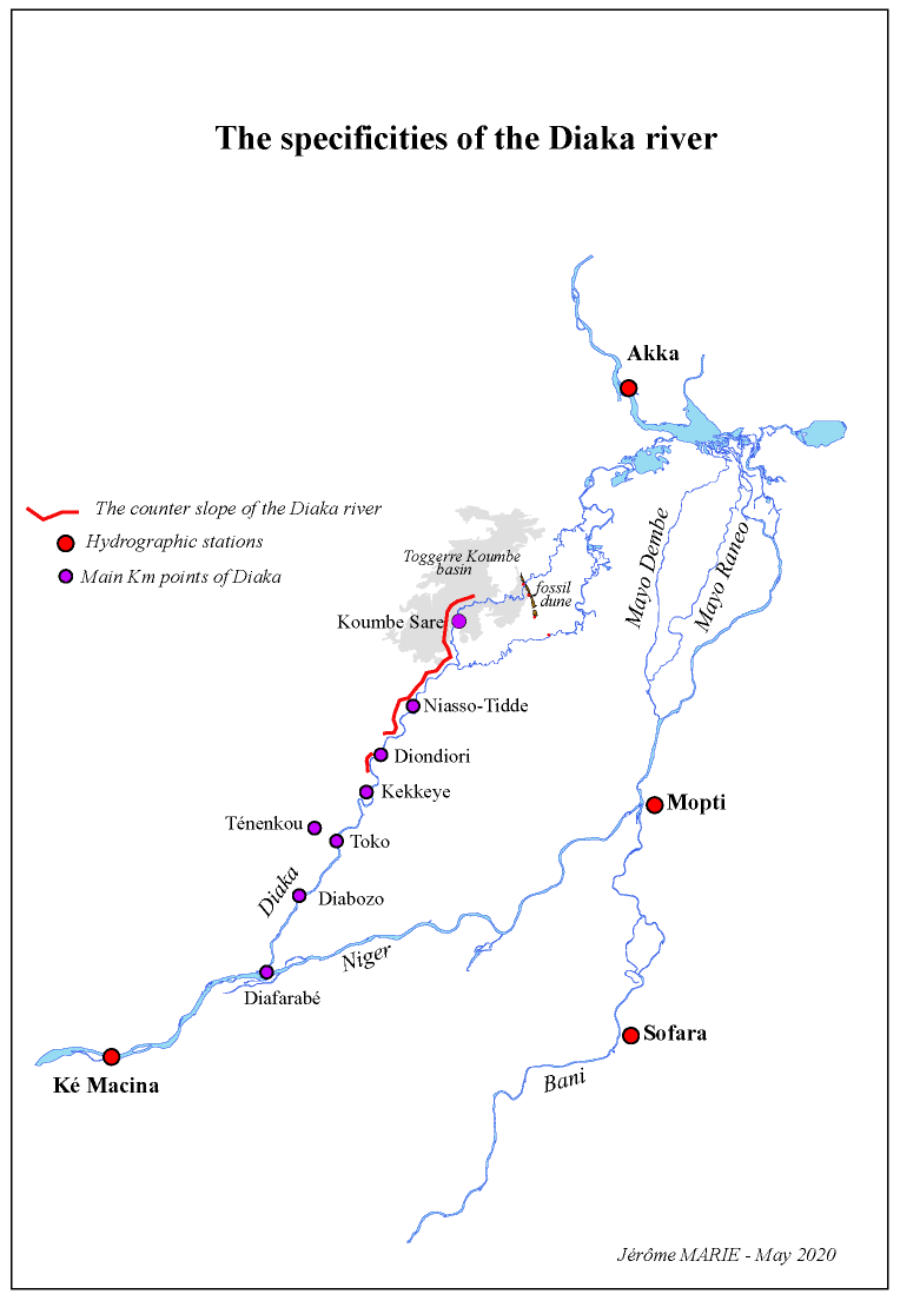
The
relatively
higher
flood
of
the
Niger
River
at
Ké
Macina
is
part
of
the
reason
for
the
mismatch
in
the
distribution
of
the
flood
between
the
western
and
eastern
parts
of
the
Delta,
but
probably
not
the
only
contributing
factor:
the
peculiar
longitudinal
altitude
profile
of
the
Diaka
could
also
be
a
factor.
Indeed,
while
the
bottom
slopes
of
the
Bani
and
Niger
rivers
are
quite
regular
(see
graphs:profil_fond), this is not true of the Diaka (see CARIMA : a Mathematical model of the Niger River - SOGREAH, 1984).
The
Niger
River
has
a
bottom
slope
of
4.5
cm
/
km
along
200
km
before
it
decreases
to
2
cm
/
km,
50
km
upstream
after
it
enters
the
Débo.
The
Bani
river
alternates
reaches
with
slopes
of
4.5
cm
/
km
and
reaches
with
very
low
slopes
(between
1
cm
and
0.8
cm
per
km).
However,
neither
of
them
presents
back
slopes
as
the
Diaka
does,
in
particular
between
km
90
and
126
downstream
from
Diafarabé.
These
back
slopes
would
explain
the
great
extent
of
the
Toggere
Koumbe
basin
and
account
in
part
for
the
dysfunction of the model with equal flood depth isolines during poor floods such as that of 1984.
The
peculiarity
of
the
altitude
profile
of
the
Diaka,
linked
to
the
transversal
dune
(NW-SE)
extending
along
the
stretch,
Saré
Béré-Sildé-Rogonta-Sormé.
This
specificity
is
not
found
east
of
the
basin
where
the
bottom
slope
of
the
Mayo
Dembé
reaches
4.3
cm
/
km
before
it
zeroes
20
km
before
it
joins
the
Débo,
highlighting
the
difference
between
the
better
flooded
northwest
part
of
the
Delta, and the poorly flooded south and east parts of the Delta.


*
With Jean Pierre Lamagat
's
model
**The height of 3.96 m is reached on 21/08 then again 3.97 m is reached on 17/10
1-
The
flooded
area
common
to
the
Landsat
images
and
the
model
-
shape
(Commun_440_1984)
-
extends
over
251,891
ha,
setting
the
confidence
ratio
of
common
area/model
at
63.3%,
a
rather
poor
achievement
in
relation
with
the
exceptional
1984
flood,
but
also
with
a
change
of
flooding
process
developed
further.
2-
The
synthesis
map
-
shape
(synthesis_440_1984)
highlights
a
partition
of
the
Delta
in
two
regions:
the
southern
and
eastern
region
suffering
from
a
strong
flood
deficit
with
the
non
flooding
of
the
Pondori,
Sebera
basins
and
along
the
Bani
River,
very
limited
flooding
of
the
Yongari-Mangari
and
Mopti
basins,
and
even
poor
flooding
of
the
Konna
basin
attached
to
the
Débo-Walado;
the
central
and
north-western
region
benefiting
from
much
better
flooding
in
the
Moura,
Sossobé,
Kadial,
Kakagnan
and
Toggere
Koumbe
basins,
as
well
as
the
western
Walado.
This
better
than
expected
flood
with
a
4.40m
height
at
the
Mopti
scale
results
in
particular
in
a
continuous
flooded
area
across
the
Kakagnan
and
Kadial
basins,
which
are
separated
by
the
model
at
isoline
-2.20
m,
and
the
same
applies
to
the
Toggere
Koumbé
and southern Walado basins.
There
are
139
593
ha
which
are
floodable
according
to
the
model
but
are
not
flooded
on
Landsat
-
shape
(inon_
moins_280)
-
,
while
143
994
ha
areas
flooded
on
Landsat
are
not
floodable
according
to
the
model
Niv_440
flooding
logic
-
shape
(inon_plus_1984).
The
area
flooded
"in
addition
to
the
model
predictions"
represents
36%
of
the
flooded
areas
observed on Landsat, which is considerable.
Simplified model for a 4.90m flood in Mopti
Extract
from
the
Landsat
image
of
November 17, 1984
![Depth Totally flooded (ha) Partially flooded (ha) [ - 0.60] 815 1 204 ] - 0.60 à - 1.05] 2 015 2 799 ] - 1.05 à - 1.70] 20 443 40 109 [ - 2.15] 39 726 36 883](index_htm_files/13379.png)
A
thorough
examination
of
the
vegetation
units
presenting
a
dense
green
vegetation
on
the
Landsat
images
while,
according
to
the
model,
they
should
not
be
flooded
with
a
flood
of
4.40
m
on
the
Mopti
gauge,
reveals
that
many
(over
800
units)
have
a
flood
depth
of
-2.15
m
assigned
by
the
model,
very
close
to
the
-2.20
m
deficit
of
the
flood
at
Mopti
in
relation
to
the
reference
flood
of
6.60m.
These
large
units
(416
ha
on
average)
are
binary
mosaics
(B
/
VOR,
B
/
O,
B
/
EOR,
VB
/
VOR,
VB
/
O,
OP
/
VOR,
OP
/
EOR,
OP
/
O)
composed
of
a
deeply
flooded
(-2.80
m)
vegetation
association
combined
with
a
fairly
flooded
(-1.50
m)
one.
One
can
think
that
the
deepest
flood
association
extends
over
the
majority
of
the
unit
area.
However,
this
will
not
completely
explain
the
discrepancy,
as
indicated
by
the
following
table,
since
associations
that
should
not
be
flooded
for
a
4.40m
level
at
Mopti
are
shown
to
be flooded on the Landsat images (with depths ranging from -0.60m to 1.70m).
440_1984.gdb contain two shapes files :
- Niv_440 :
The raw calculated model
-Synthèse_440_1984
with the following items:
sigle
: acronym of vegetal associations
niveau
: level of vegetal association
profond
: submersion depth of vegetal associations
Value:
1 = water
2 = flooded vegetation
Inon
: 1 = ttotally flooded
2 = partially flooded
Value and Inon come from the analysis of Landsat Images
Synthèse : 1 = commun_440_1984
2 = inon_plus_1984
3= inon_moins_1984
Synthèse 1+2= Veg7_1984 (Landsat)
et 1+3 = Niv_440_Veg7
Profil_fonds.rar


440_1984.gdb
Download
Download